为您精心推荐以下火爆游戏,希望您有个愉快的一天
长期以来,Software FX 通过不断的努力奠定了其在数据可视化标准领域的地位,通过与微软 WPF 开发团队的紧密合作,Chart FX for WPF 将顶尖的WPF技术与 Chart FX 丰富的功能结合到了一起,使应用程序变得更加有趣且直观,围绕 WPF 的特性——灵活、可视化与友好的用户界面,让企业级程序中的数据浏览和分析获得全新体验!
Chart FX for WPF 充分利用WPF的3D引擎,使用户能处理任何图表元素并同样能提供并行的UI以使数据的分析变得更加直观。通过出众的图表类型、动画效果、图案主题、设计布局、调色板、边框以及多条中轴,Chart FX for WPF 能让开发人员在几分钟之内创建出效果最炫的图表。基于XAML 并完全支持自定义的特性,使你可以将 Chart FX for WPF 制作的图表与开发程序完美结合。
更令人兴奋的是,Chart FX for WPF 借助 .NET Framework 3.5的优势并结合 LINQ 支持,做到了与 Visual Studio 与 Expression Blend 的无缝整合。
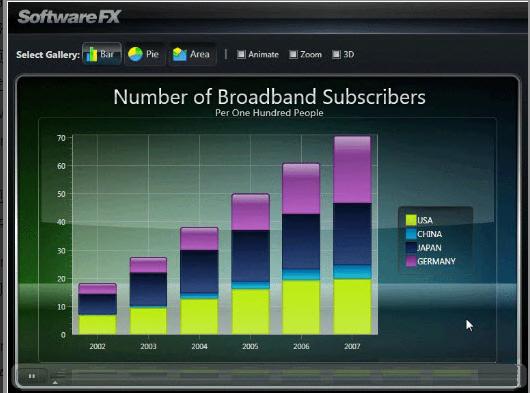
Chart FX for WPF最小化图例空间教程
风格化标题来模仿图例的样式:
在Chart FX for WPF中,标题都是全部可以样式化的,虽然通常标题都是字符串,但是实际上你也可以在标题中使用任何的WPF 视觉效果,这种方法就有一个问题,你必须编写很多关于标题的信息,比如说系列的数量、颜色等,这样的话,将会导致很多不适用的且大数据量的代码信息,而且将不会有高亮的效果。
在标题下方显示图例:
删除图例边框,并将图例的边框停靠到顶部。
<cfx:Chart.Titles>
<cfx:Title>Sales in 1998</cfx:Title>
</cfx:Chart.Titles>
<cfx:Chart.LegendBox>
<cfx:LegendBox cfx:Chart.DockBorder="None"DockPanel.Dock="Top"/>
</cfx:Chart.LegendBox>
值得注意的是,默认的类样式会在区域空间外较大的绘制主要的标题,但是如果你比较喜欢将这两个放在一起,你可以修改图例中的目标面板,如果没有产生想要的效果,你可以更新生成的方式:
<cfx:Chart.LegendBox>
<cfx:LegendBox cfx:Chart.DockBorder="None"DockPanel.Dock="Top"
cfx:Chart.TargetPanel="Titles-0"/>
</cfx:Chart.LegendBox>
将标题和图例放在一行中:
如果序列的数量比较小的话,就可以将标题和图例结合起来:
<Style x:Key="LegendTitleStyle"TargetType="{x:Type ItemsControl}">
<Setter Property="Template">
<Setter.Value>
<ControlTemplate>
<StackPanel Orientation="Horizontal">
<StackPanel Orientation="Horizontal"IsItemsHost="True"
VerticalAlignment="Top"/>
<TextBlock VerticalAlignment="Top"Text="{Binding Path=Tag}"/>
</StackPanel>
</ControlTemplate>
</Setter.Value>
</Setter>
</Style>
<DataTemplate x:Key="LegendTitleItem">
<StackPanel Orientation="Horizontal">
<StackPanel.Resources>
<cfxConverters:BoolToVisibilityConverter x:Key="BoolToVisibility"/>
</StackPanel.Resources>
<StackPanel VerticalAlignment="Top"x:Name="textAndLine">
<Border Background="Transparent">
<ContentControl IsHitTestVisible="false"Content="{Binding Path=Content}"
ContentTemplate="{Binding Path=ContentTemplate}"
Foreground="{Binding Path=Foreground}"
FontFamily="{Binding Path=FontFamily}"
FontSize="{Binding Path=FontSize}"
FontStyle="{Binding Path=FontStyle}"
FontWeight="{Binding Path=FontWeight}"/>
</Border>
<Rectangle Fill="{Binding Path=Stroke}"Height="3"/>
</StackPanel>
<TextBlock Text=" "/>
<TextBlock Text="Vs "IsHitTestVisible="false"
Visibility="{Binding Path=LastInGroup,
Converter={StaticResource BoolToVisibility},
ConverterParameter=false}"/>
</StackPanel>
<DataTemplate.Triggers>
<DataTrigger Binding="{Binding Path=Dimmed}">
<DataTrigger.Value>
<sys:Boolean>True</sys:Boolean>
</DataTrigger.Value>
<Setter Property="Opacity"Value="0.25"TargetName="textAndLine"/>
</DataTrigger>
</DataTemplate.Triggers>
</DataTemplate>
<cfx:Chart.LegendBox>
<cfx:LegendBox cfx:Chart.DockBorder="None"DockPanel.Dock="Top"
Tag="Sales in 1998"
ContainerStyle="{StaticResource LegendTitleStyle}">
<cfx:LegendBox.ItemAttributes>
<cfx:LegendItemAttributes cfx:LegendItemAttributes.LegendItemType="Series"
Template="{StaticResource LegendTitleItem}"/>
</cfx:LegendBox.ItemAttributes>
</cfx:LegendBox>
</cfx:Chart.LegendBox>

 支持本款手游